


Grow Super Listeners with Spotify for Artists Analytics for Hip-Hop

Spotify for Artists shows artists their audience, music, and playlist data, plus live counts for new releases. The single most important move for independent hip-hop acts is checking the Segments tab and Release engagement metrics first, since those two numbers reveal whether passive listeners are turning into followers and saves.
TL;DR:
- Super listeners, who stream an artist 15 or more times in 28 days, drive the majority of streams and merchandise purchases, making them crucial for growth.
- The first seven days of a release should be monitored with the real-time counter, focusing on launch momentum and audience source segments.
- Tracking changes in previously active listeners and follower growth over time provides a deeper understanding of fan loyalty and potential future streams.
- Playlist contribution data and geographic listener hotspots help target promotional efforts, merch, or shows in the most engaged cities.
- Most analytics update daily, but demographic and playlist attribution data can lag by a day or more, requiring use alongside other tools for accurate strategy.
Table of Contents
- Understanding Spotify for Artists Analytics: What the Dashboard Covers
- Audience Segments and Super Listeners: Why They Matter More Than Total Streams
- Real-Time Counts, Historical Windows, and What Changed Recently
- Release Engagement and Campaign Kit: Turning Tools Into Measurable Moves
- Metrics That Matter: Active Audience Beats Vanity Numbers
- Turning Analytics Into Action: A Lit Nightz Checklist for Hip-Hop Artists
- Comparing Spotify for Artists Analytics With Other Streaming Platforms
- Limitations and How Often the Data Actually Updates
- Perspective: Analytics Rewards the Long Game, Not the Viral Spike
- Optional Boost: Pairing Analytics With Lit Nightz News Promotion
- Primary Sources for Deeper Reading
- Sources
- FAQ
Understanding Spotify for Artists Analytics: What the Dashboard Covers
The dashboard splits into three tabs, and each one answers a different question. Music shows performance for individual songs and albums, including daily stream timelines you can filter by date range. Audience breaks down who’s listening, by age, gender, and location. Playlists shows which playlists are driving streams and how much each one contributes to a song’s total.
A few operational details matter here:
- Timelines run on daily counts in UTC, so a release that drops late at night in the United States might show its first spike on the “wrong” calendar day.
- Data can be exported for deeper analysis in a spreadsheet, which helps when comparing multiple releases side by side.
- Share-of-streams by playlist source sits inside the Playlists tab under each track, showing exactly which curated or algorithmic playlist moved the needle.
Artists chasing playlist placements should check this tab weekly rather than guessing which pitch worked.

Audience Segments and Super Listeners: Why They Matter More Than Total Streams
Spotify groups listeners into three engagement tiers, and knowing the difference changes how you plan a rollout. Monthly active listeners streamed an artist’s music in the past 28 days. Previously active listeners engaged in the past but have gone quiet. Programmed listeners heard the artist mainly through algorithmic or editorial playlists rather than by seeking the music out directly, according to Spotify’s own segmentation guide.
Above all these sits the super listener, defined as someone who streams an artist intentionally 15 or more times within 28 days.
Statistic Callout: Spotify identifies super listeners as its most engaged audience segment, and that group tends to drive a disproportionate share of both streams and merchandise purchases.
Practical uses for the Segments tab:
- Spot how many previously active listeners exist before a new release, then target them with pre-save campaigns.
- Compare programmed versus organic share-of-streams to see if playlist placements are converting into real fans or just passing through.
- Watch super listener counts month over month as the clearest signal of whether a fanbase is deepening or just widening.
Real-Time Counts, Historical Windows, and What Changed Recently
New releases get a real-time counter that updates every two seconds for the first seven days, which is the fastest feedback loop artists get on any streaming platform. Watching that counter during launch week shows momentum, or the lack of it, almost as it happens.
Spotify has also changed how historical data displays by default, often defaulting views to the last 12 months. Custom date ranges still let artists pull up to two years of comparison data, which matters for tracking growth year over year rather than release over release.
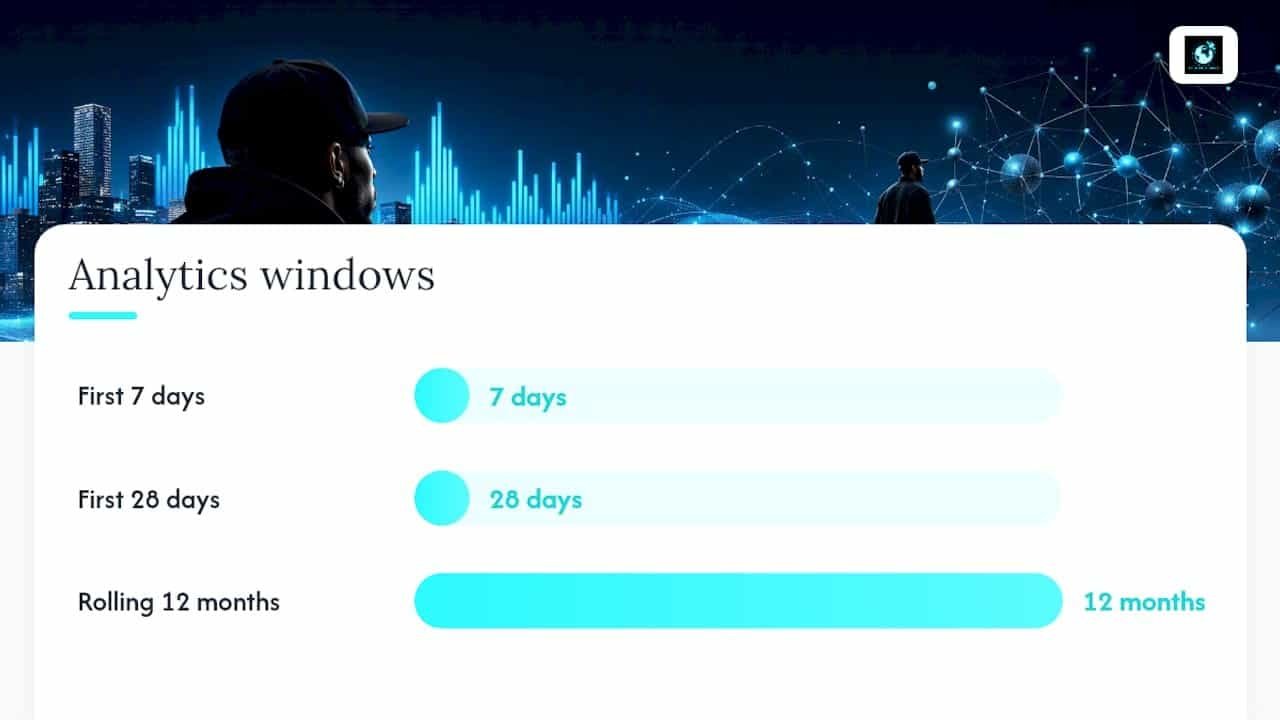
For comparison purposes, three windows work best: the first 7 days (launch intensity), the first 28 days (early conversion), and a rolling 12 months (overall trajectory). Stack all three and you get a fuller picture than any single number provides.
Release Engagement and Campaign Kit: Turning Tools Into Measurable Moves
Campaign Kit bundles several promotional tools tied directly to measurable outcomes. Marquee puts a release in front of listeners on the home screen. Pitching gets a track considered for editorial playlists before it drops. Discovery Mode boosts algorithmic recommendation in exchange for a royalty tradeoff. Showcase runs paid cards inside the app pointing to a release. Together, these tools connect directly to the metrics artists can track afterward.
Release engagement metrics worth watching in the first 28 days: daily active listeners, saves per stream, and follower conversion rate.
A simple launch sequence:
- Pitch the track at least a week before release.
- Set up Marquee or Showcase to run during launch week.
- Watch the real-time counter daily for the first seven days.
- Check saves and follower conversion at day 28.
- Compare share-of-streams by segment to decide who to re-engage next.
Pro Tip: Don’t judge a release by day-one numbers alone. Spotify’s own guidance treats a new release as a launchpad for reactivating quiet fans, not just a one-time spike to celebrate or panic over.

Metrics That Matter: Active Audience Beats Vanity Numbers
Total streams look impressive on a screenshot, but they don’t tell you much about career trajectory. For strategies on translating streams into lasting fan growth, artists can benefit from learning how to improve user engagement for lasting growth. Four numbers matter more:
- Monthly active listeners — the truest read on current momentum.
- Followers — because following an artist makes someone several times more likely to stream that artist’s music in the following months.
- Saves — a stronger intent signal than a stream, since saving requires a deliberate action.
- Share-of-streams from active (non-programmed) sources — proof that fans are seeking the music out, not just hearing it passively.
Playlist contribution data and top-city breakdowns feed directly into promotion planning. If three cities account for a disproportionate share of listens, that’s where a small-ticket merch drop or a pop-up show will land hardest. Follower growth, more than any single stream count, predicts whether next month’s numbers go up or down. That’s why conversion, turning a passive listener into a follower, matters more for long-term revenue than a single viral spike.
Turning Analytics Into Action: A Lit Nightz Checklist for Hip-Hop Artists
Data means nothing without a follow-up plan. Here’s a sequence built around what the dashboard actually shows you:
- Track the real-time counter for the first week, then pull segment share-of-streams on day eight to see where the audience actually came from.
- Identify the top three cities by listener share and run a targeted promo, merch drop, or micro-show in each.
- Compare previously active versus monthly active counts monthly to catch fans slipping away before they’re gone for good.
- Use a release checklist to line up pitching, Marquee, and merch timing before the drop, not after.
| Action | Metric to Watch | Timing |
|---|---|---|
| Monitor launch momentum | Real-time stream count | Days 1–7 |
| Assess conversion | Saves, follower growth | Day 28 |
| Plan reactivation | Previously active segment share | Monthly |
| Target promotion geographically | Top cities by listener share | Ongoing |
Artists also weighing pricing and monetization decisions should factor in realistic pay-per-stream economics before betting an entire promo budget on stream volume alone.
Comparing Spotify for Artists Analytics With Other Streaming Platforms
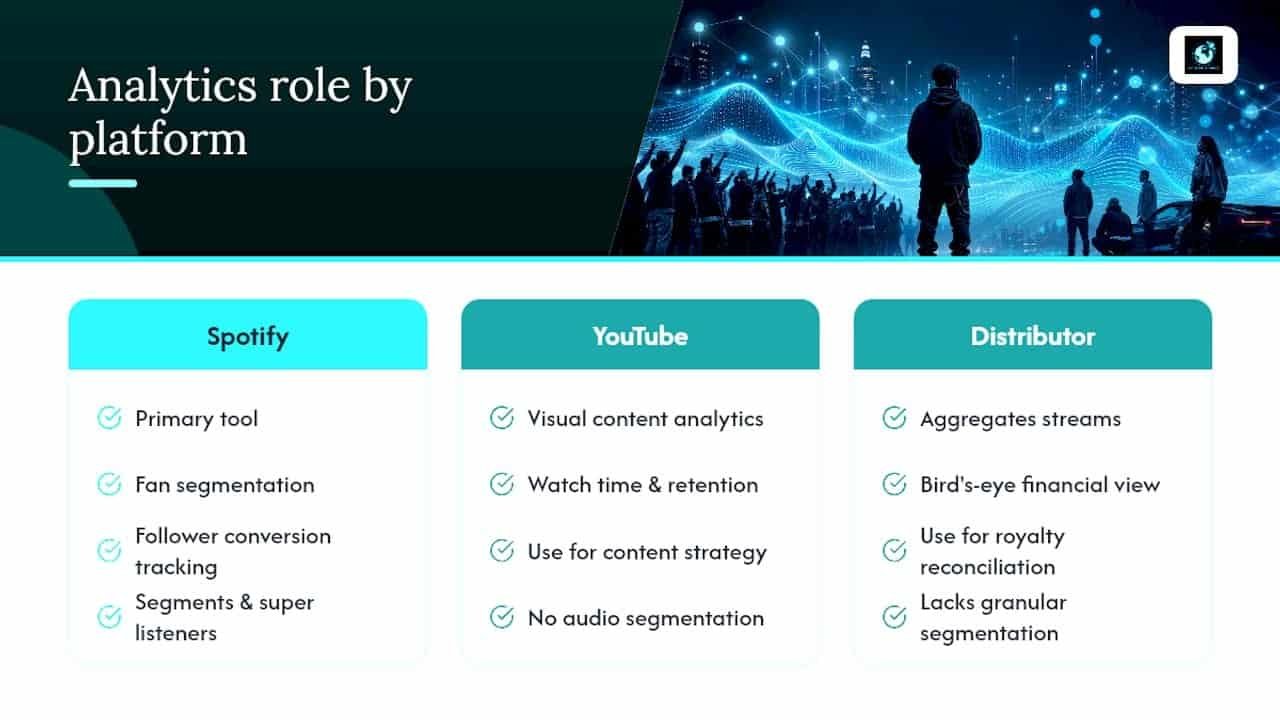
Spotify for Artists isn’t the only analytics dashboard in an independent artist’s toolkit, and it isn’t meant to work alone. Apple Music for Artists offers similar audience breakdowns with a heavier emphasis on Shazam data, useful for spotting early discovery signals Spotify doesn’t track the same way. YouTube Studio gives a much deeper look at watch time and audience retention for visual content, something Spotify’s platform doesn’t cover at all since it deals almost entirely in audio.
Distributor dashboards, the kind that come bundled with services like DistroKid or TuneCore, tend to aggregate streams across platforms into one combined view. That’s useful for a bird’s-eye financial picture, but those dashboards typically strip out the granular audience segmentation Spotify provides. The Segments tab, the super listener designation, and the follower conversion data described earlier don’t have a direct equivalent on most competing platforms.

The practical approach for a hip-hop artist working across platforms: use Spotify for Artists as the primary tool for fan segmentation and conversion tracking, since it offers the deepest audience-behavior data of any single DSP. Layer in YouTube Studio for content and watch-time strategy, and use a distributor’s combined dashboard mainly for royalty reconciliation rather than audience insight. No single platform replaces the others, but Spotify’s segmentation tools currently go further than most competitors in showing not just how many people listened, but how deeply they’re engaged.
Limitations and How Often the Data Actually Updates
Spotify for Artists updates most metrics daily, though the real-time counter for new releases refreshes every two seconds during the first week before settling into the standard daily cadence. That means artists get near-instant feedback at launch, but slower-moving metrics like demographic breakdowns and playlist attribution can lag by a day or more.
The dashboard also has real gaps. It doesn’t show revenue directly, only stream counts, leaving artists to estimate earnings using royalty rate context from elsewhere. Demographic data is aggregated and anonymized, so there’s no way to identify individual listeners or build a true CRM-style fan list from inside the platform. Historical views defaulting to the last 12 months can also obscure longer-term trends unless an artist remembers to pull a custom range.
Smaller catalogs face another limitation: low stream counts on newer releases sometimes produce sparse or delayed demographic data, since Spotify needs a minimum volume of activity before it reliably populates certain charts. Artists with a handful of songs and modest streams should expect thinner data than a catalog with years of consistent releases. None of this makes the tool unreliable, but it does mean analytics should inform decisions alongside distributor reports and direct fan feedback, not replace them entirely.
Perspective: Analytics Rewards the Long Game, Not the Viral Spike
The real value in this data isn’t a single big release week. It’s watching super listener counts and follower retention climb over months. Visuals like Canvas, consistent storytelling, and steady follow-up with previously active fans do more for a career than chasing one viral moment ever will.
— Stephanos G
Optional Boost: Pairing Analytics With Lit Nightz News Promotion
Spotify for Artists tells you which fans are already leaning in. Getting more of the right listeners to discover the music in the first place is a separate problem, and that’s where Lit Nightz News is the alternative to a traditional PR agency for hip-hop artists trying to reach an audience that already follows the culture closely.

Get Featured on Lit Nightz News puts an artist or brand in front of readers who are actively following hip-hop, R&B, and urban culture news, the same audience segment most likely to convert into monthly active listeners once they hear a track. The placement is a one-off opportunity offered for a fee and is designed to complement other conversion tactics rather than replace them. Analytics tell you who’s engaged; a featured placement helps you find more people worth engaging in the first place.

Artists ready to add that layer of exposure can get featured on Lit Nightz News and pair the placement with a release timeline already mapped out using Segments and Release engagement data.
Primary Sources for Deeper Reading
- How to Read Your Spotify for Artists Data — official breakdown of real-time counts and dashboard navigation.
- The Complete Guide to Audience Segments — Spotify’s own definitions for segments and super listeners.
- Fan Study — Spotify’s research on treating releases as fan reactivation moments.
Sources
- How to Read Your Spotify for Artists Data – Spotify for Artists
- The Complete Guide to Audience Segments in Spotify for Artists – Spotify for Artists
FAQ
How Can I See My Spotify Artist Stats?
Claim an artist profile through Spotify for Artists, then log into the dashboard to view the Music, Audience, and Playlists tabs. Streams, saves, followers, and audience segments all appear there, updated daily with a faster real-time counter during a release’s first seven days.
How Many Streams on Spotify Does It Take to Make $1,000,000?
Royalty rates vary by market, subscription type, and label deal, so there’s no single fixed number. Using the pay-per-stream context in Lit Nightz News’s indie hip-hop earnings breakdown, artists can estimate rough stream volume needed at their specific rate rather than relying on a flat industry myth.
What Is the Top 0.005% on Spotify?
This figure gets repeated across social media referencing an extremely small tier of the most-streamed artists worldwide, but Spotify hasn’t published an official definition tied to that exact percentage. Treat it as informal commentary rather than a confirmed platform statistic.
What Analytics Can Spotify Artists See?
Artists can see stream counts, saves, followers, listener demographics (age, gender, location), playlist contribution, real-time launch data, and audience segments including super listeners. They cannot see individual listener identities or direct revenue figures inside the dashboard itself.
Why Do Followers Matter More Than Total Streams?
Followers matter because following an artist makes someone several times more likely to stream that artist’s music in later months. A high stream count from passive or programmed listening doesn’t predict future engagement the way follower growth does.
Understanding these numbers is one piece of building a sustainable career in hip-hop, and the same discipline that applies to reading a dashboard applies to reading the business side of the industry. Readers looking to go deeper can check Lit Nightz News’s ongoing coverage of artist earnings, release strategy, and promotion tactics for independent acts navigating the same charts and segments covered here.
Recommended
- Top 6 Music Industry Trends Shaping Rap and Hip-Hop
- Music marketing for hip-hop artists: 5 strategies for 2026
- Growing Your Artist Profile: 90-Day Playbook for Hip-Hop


No Comments